I deal with a lot of servers at work, and one thing everyone wants to know about their servers is how close they are to being at max utilization. It should be easy, right? Just pull up top or another system monitor tool, look at network, memory and CPU utilization, and whichever one is the highest tells you how close you are to the limits.
And yet, whenever people actually try to project these numbers, they find that CPU utilization doesn’t quite increase linearly. But how bad could it possibly be?
To answer this question, I ran a bunch of stress tests and monitored both how much work they did and what the system-reported CPU utilization was, then graphed the results.
Setup
For my test machine, I used a desktop computer running Ubuntu with a Ryzen 9 5900X (12 core / 24 thread) processor. I also enabled Precision Boost Overdrive4 (i.e. Turbo5).
I vibe-coded a script6 that runs stress-ng7 in a loop, first using 24 workers and attempting to run them each at different utilizations from 1% to 100%, then using 1 to 24 workers all at 100% utilization. It used different stress testing method and measured the number of operations that could be completed (“Bogo ops1”).
The reason I did two different methods was that operating systems are smart about how they schedule work, and scheduling a small number of workers at 100% utilization can be done optimally (spoilers) but with 24 workers all at 50% utilization it’s hard for the OS to do anything other than spreading the work evenly.
Results
You can see the raw CSV results here8.
General CPU
The most basic test just runs all of stress-ng’s CPU stress tests in a loop.
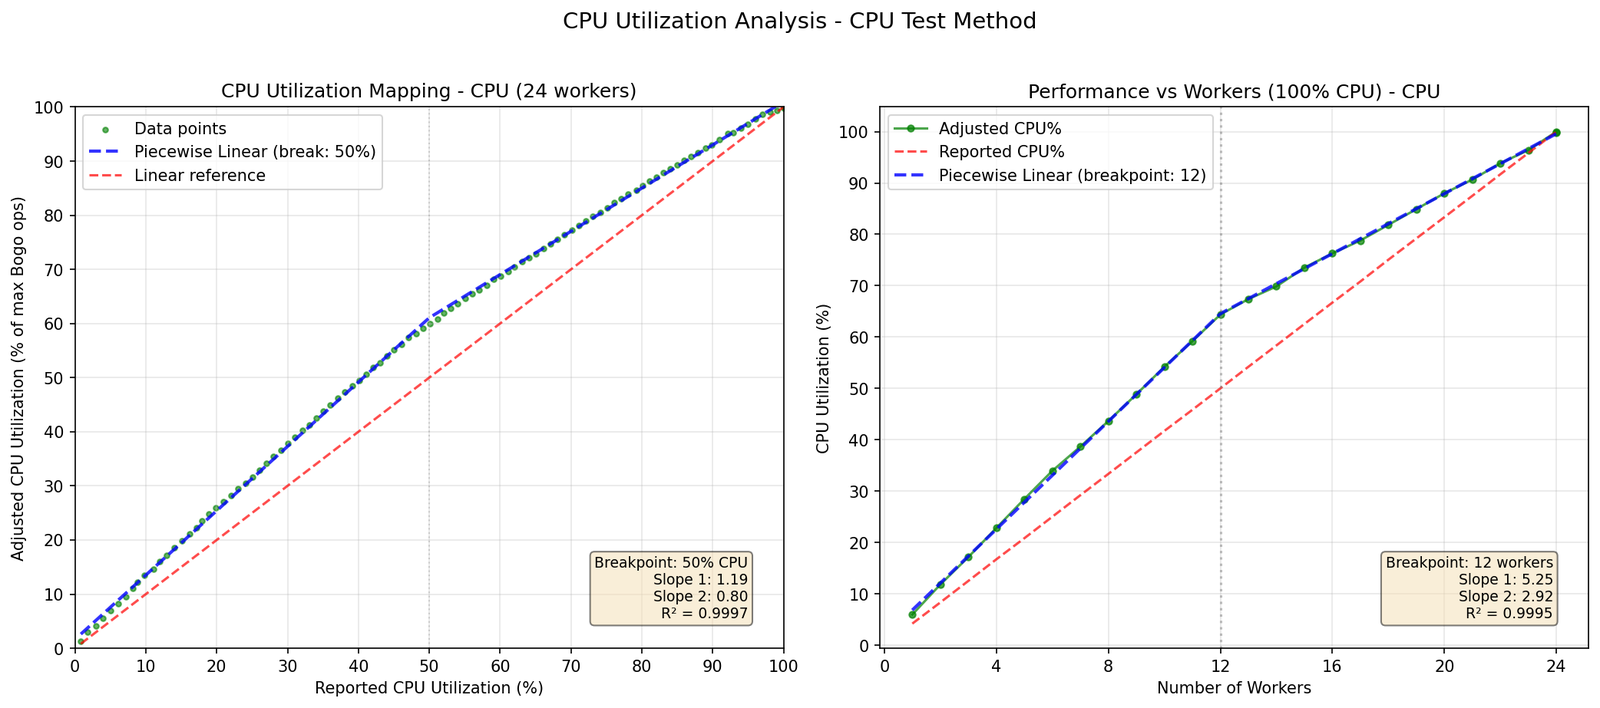
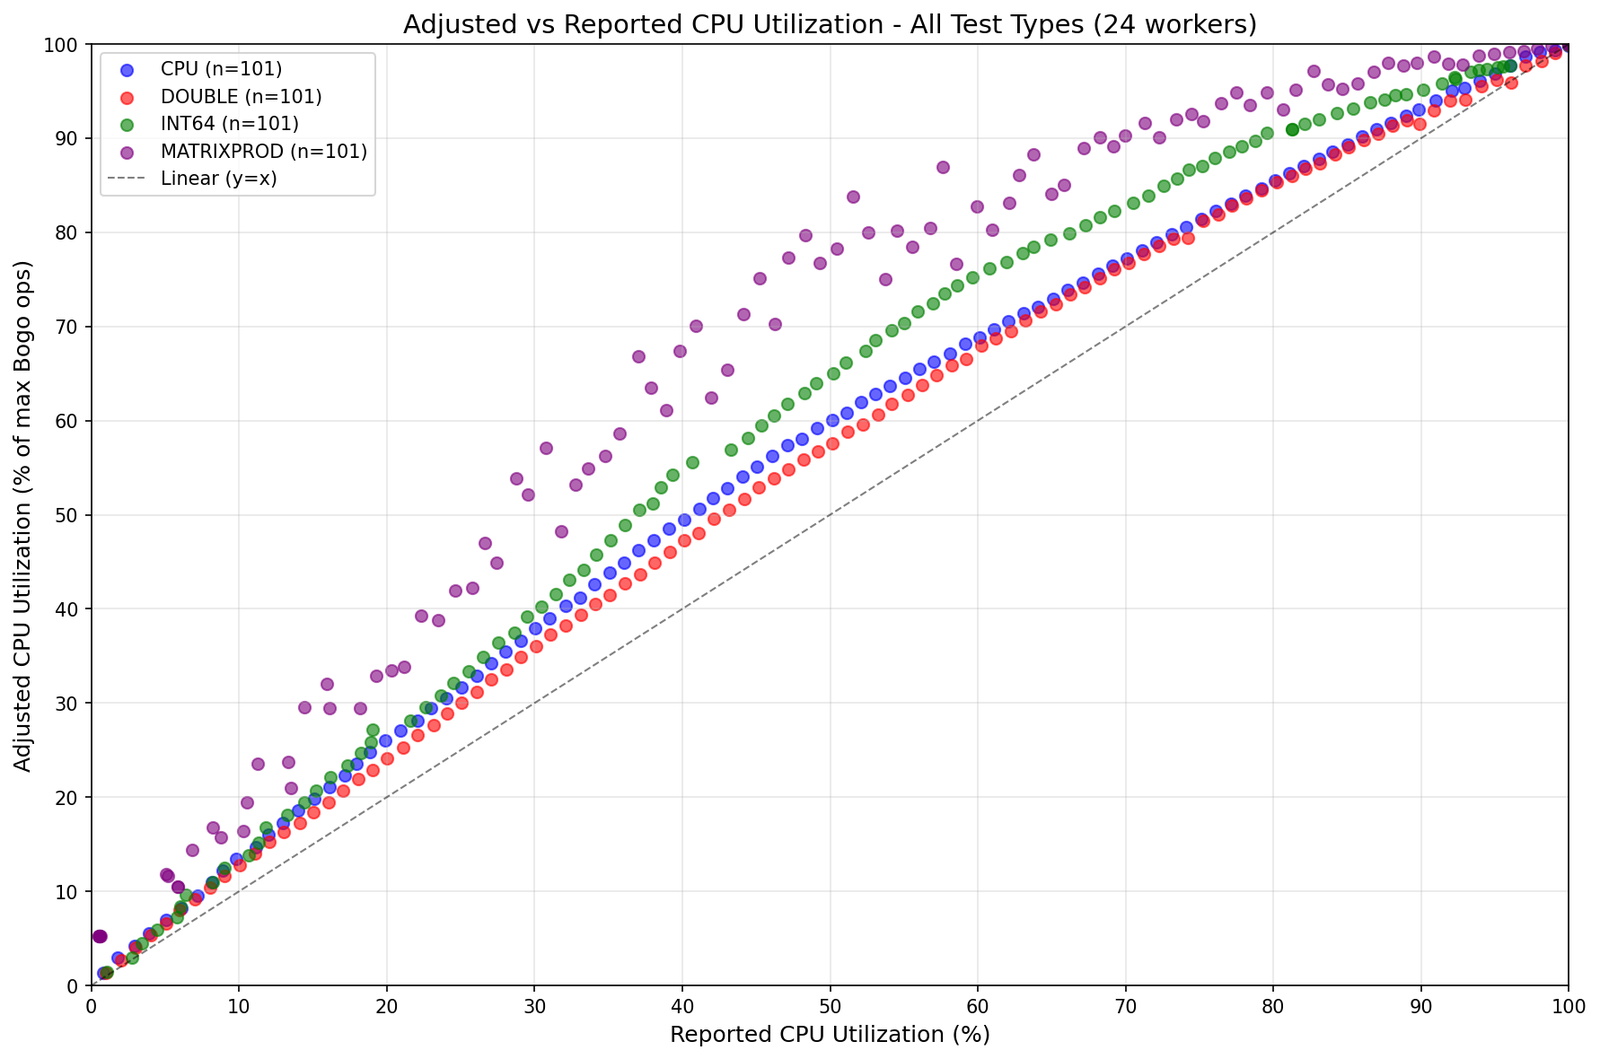
You can see that when the system is reporting 50% CPU utilization, it’s actually doing 60-65% of the actual maximum work it can do.
64-bit Integer Math
But maybe that one was just a fluke. What if we just run some random math on 64-bit integers?
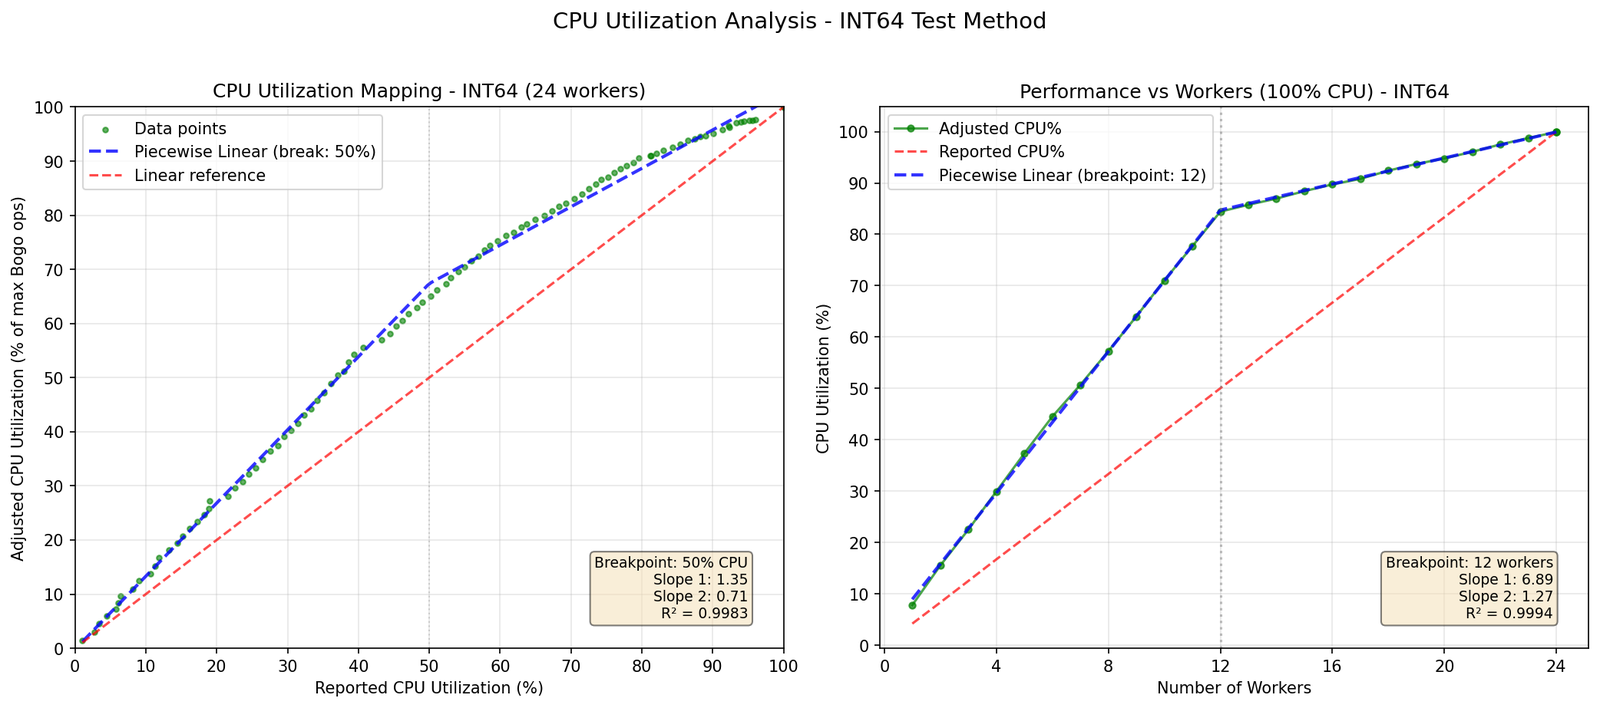
This one is even worse! At “50% utilization”, we’re actually doing 65-85% of the max work we can get done. It can’t possibly get worse than that though, right?
Matrix Math
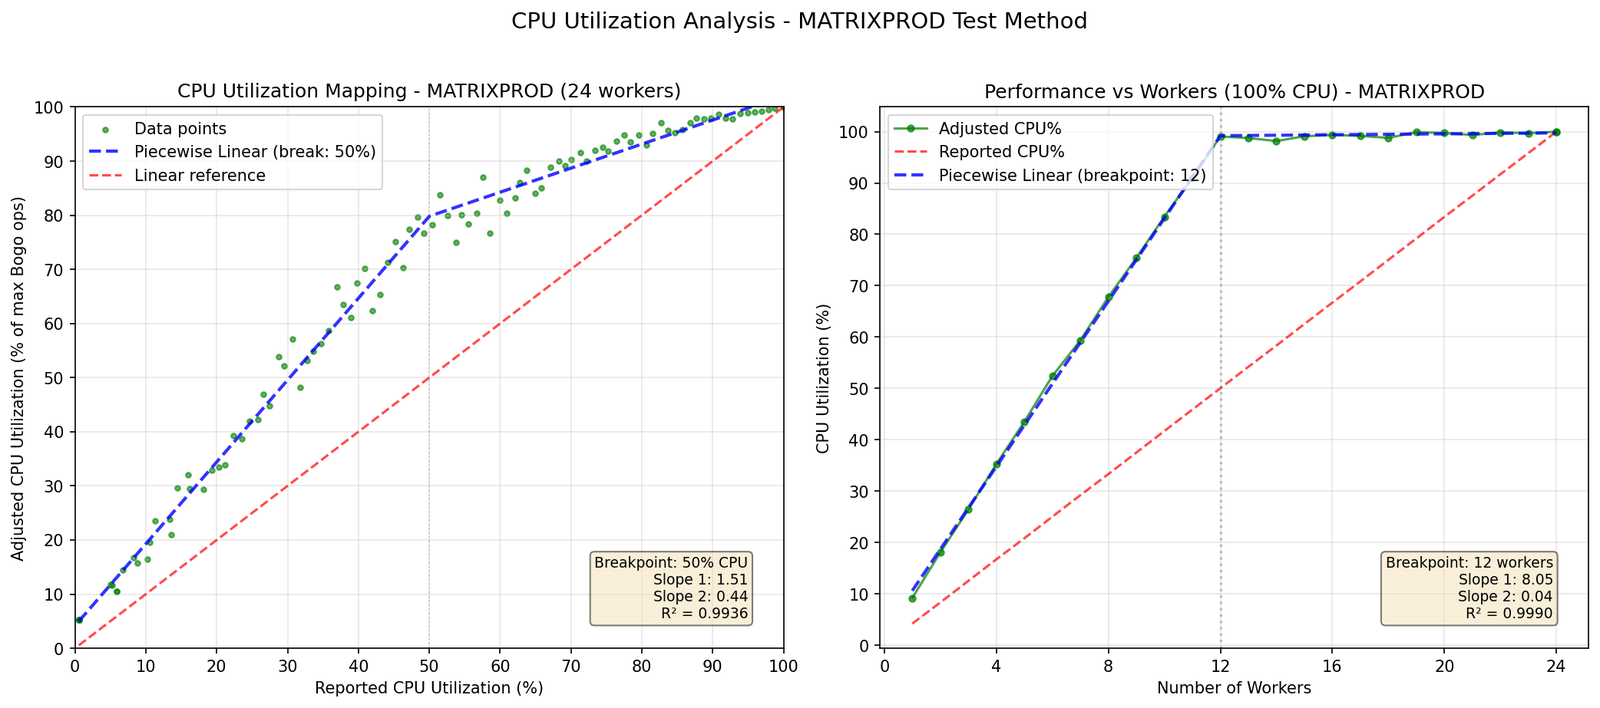
Something is definitely off. Doing matrix math, “50% utilization” is actually 80% to 100% of the max work that can be done.
In case you were wondering about the system monitor screenshot from the start of the article, that was a matrix math test running with 12 workers, and you can see that it really did report 50% utilization even though additional workers do absolutely nothing (except make the utilization number go up).
Bonus: Nginx
Someone on Hacker News9 suggested running a real benchmark, so I ran the Phoronix Test Suite Nginx benchmark10 pinned to 1-24 cores (unfortunately I can’t control the CPU utilization more finely, so you only get one graph).
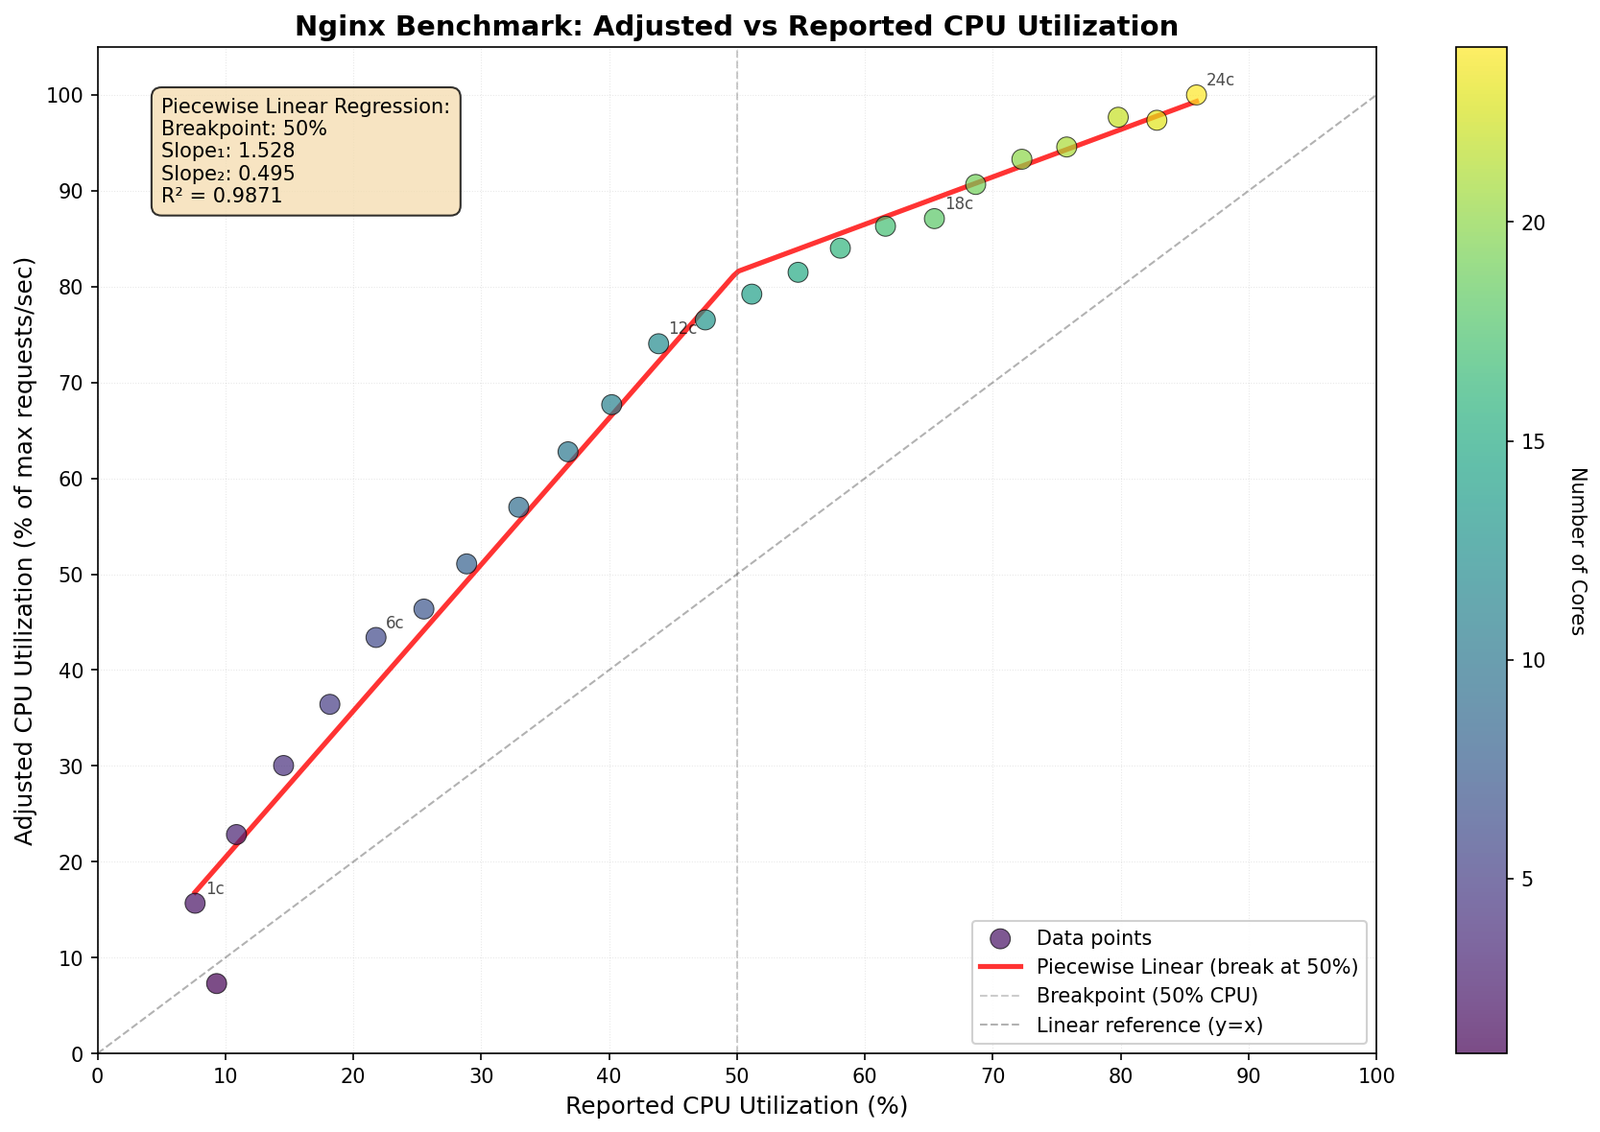
Here, we get reported utilization starting as an underestimate and then getting worse. At 50% reported utilization, we’re actualy at 80% of max requests per second, and at 80% reported utilization we’re actually at 100% of our request capacity.
What’s Going On?
SMT / Hyperthreading
You might notice that this the graph keeps changing at 50%, and I’ve helpfully added piecewise linear regressions showing the fit.
The main reason this is happening is Simultaneous Multithreading (SMT)11 / hyperthreading12: Half of the “cores” on this machine (and most machines) are sharing resources with other cores. If I run 12 workers on this machine, they each get scheduled on their own physical core with no shared resources, but once I go over that, each additional worker is sharing resources with another. In some cases (general CPU benchmarks), this makes things slightly worse, and in some cases (SIMD13-heavy matrix math), there are no useful resources left to share.
Turbo
It’s harder to see, but Turbo5 is also having an effect. This particular processor runs at 4.9 GHz at low utilization, but slowly drops to 4.3 GHz as more cores become active2.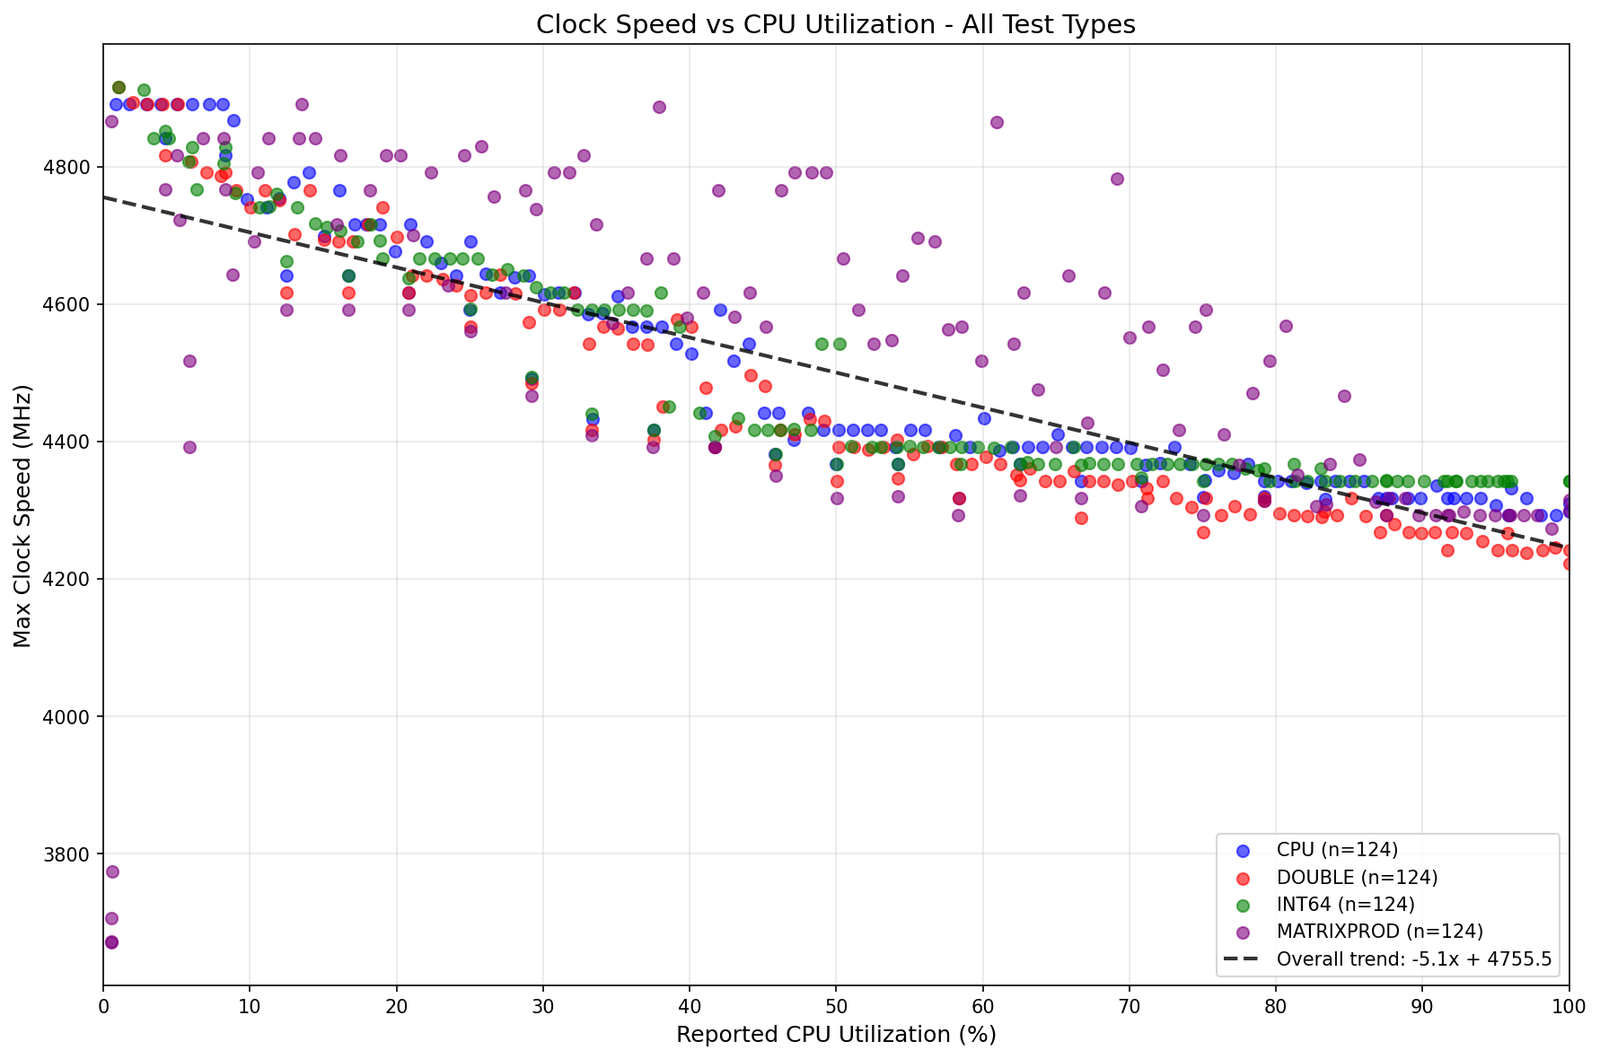
Since CPU utilization is calculated as busy cycles / total cycles, this means the denominator is getting smaller as the numerator gets larger, so we get yet another reason why actual CPU utilization increases faster than linearly.
Does This Matter?
If you look at CPU utilization and assume it will increase linearly, you’re going to have a rough time. If you’re using the CPU efficiently (running above “50%” utilization), the reported utilization is an underestimate, sometimes significantly so.
And keep in mind that I’ve only shown results for one processor, but SMT performance and Turbo behavior can vary wildly between different processors, especially from different companies (AMD vs Intel).
The best way I know to work around this is to run benchmarks and monitor actual work done:
- Benchmark how much work your server can do before having errors or unacceptable latency.
- Report how much work your server is currently doing.
- Compare those two metrics instead of CPU utilization.
Bogo ops is presumably a reference to BogoMIPS14, a “bogus” benchmark that Linux does at startup to very roughly understand CPU performance. ↩
One of the main constraints processors operate under is needing to dissipate heat fast enough. When only one core is running, the processor can give that core some of the heat headroom that other cores aren’t using and run it faster, but it can’t do that all of the cores are running.
Power usage works similarly and can be a constraint in some environments (usually not in a desktop computer, but frequently in servers). ↩
https://www.lesswrong.com/posts/mwsLdPoEQBrSEKgRy/cpu-utilization-is-a-lie#Matrix_Math - “%CPU Utilization Is A Lie — LessWrong”
https://www.amd.com/en/resources/support-articles/faqs/CPU-PB2.html - “AMD Ryzen™ Technology: Precision Boost 2 Performance Enhancement”
https://en.wikipedia.org/wiki/AMD_Turbo_Core - “Wikipedia: AMD Turbo Core”
https://github.com/brendanlong/cpu-utilization-graphs - “GitHub - brendanlong/cpu-utilization-graphs”
https://github.com/ColinIanKing/stress-ng - “GitHub - ColinIanKing/stress-ng: This is the stress-ng upstream project git repository. stress-ng will stress test a computer system in various selectable ways. It was designed to exercise various physical subsystems of a computer as well as the various operating system kernel interfaces”.
https://docs.google.com/spreadsheets/d/1QKdYa3NIFGTixG_LdnsbwbeLDnE2GNVVsS9-dfkcT20/edit?usp=sharing - “stress_test_results_20250901_192322 - Google Sheets”
https://news.ycombinator.com/item?id=45111995 - “Uses stress-ng for benchmarking, even though the stress-ng documentation says it… | Hacker News”
https://openbenchmarking.org/test/pts/nginx - “NGINX Benchmark Benchmark - OpenBenchmarking.org”
https://en.wikipedia.org/wiki/Simultaneous_multithreading - “Wikipedia: Simultaneous multithreading”
https://en.wikipedia.org/wiki/Hyper-threading - “Wikipedia: Hyper-threading”
https://en.wikipedia.org/wiki/Single_instruction,_multiple_data - “Wikipedia: Single instruction, multiple data”
https://en.wikipedia.org/wiki/BogoMips - “Wikipedia: BogoMips”